
Melcor REIT announces Q4 and 2021 annual results, declares $0.04 distribution for March 2022
Annual Highlights(1)
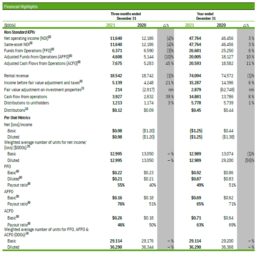
- Rental revenue was steady at $74.09 million
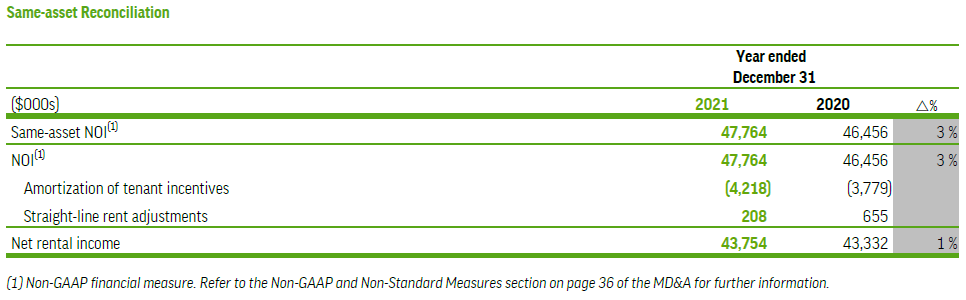
- Net rental income grew 1% to $43.75 million
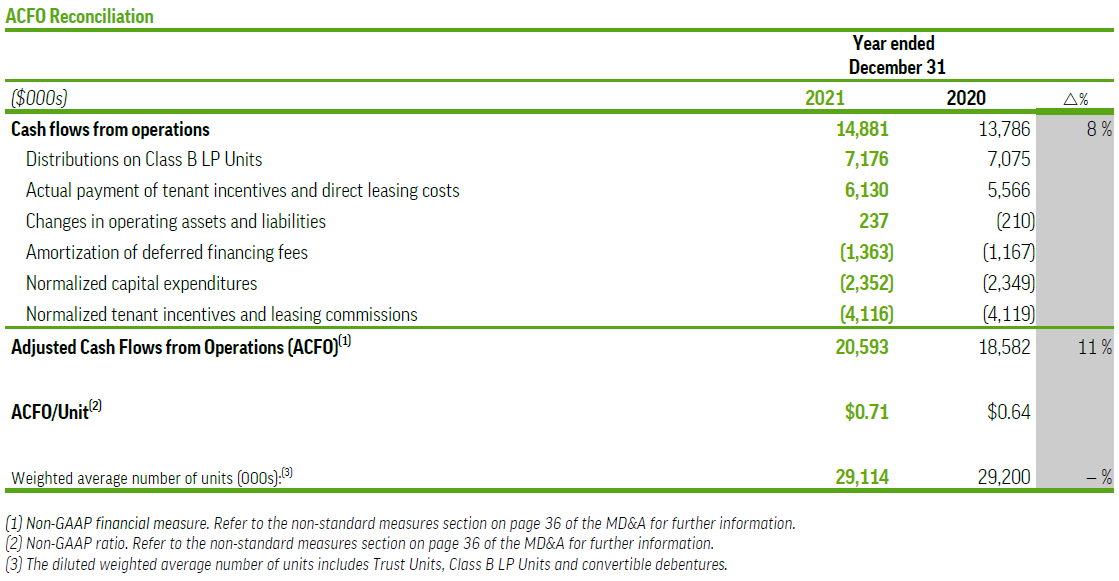
- Adjusted cash flow from operations (ACFO) grew 11% to $20.59 million or $0.71 per unit
- Debt to Gross Book Value (GBV) ratio of 49% (58% including convertible debentures)
- Distributions of $0.45 per unit paid out for an ACFO payout ratio of 63% (FFO: 49%) compared to 69% (FFO: 51%) in 2020
(1) Readers are reminded that established key performance measures may not have standardized meaning under GAAP. For further information on the REIT’s non-standard measures, non-GAAP measures, operating measures and non-GAAP ratios, refer to the information in the press release below along with the Non-GAAP and Non-Standard Measures section on page 36 of the MD&A
Quarterly Highlights
- Steady rental revenue of $18.54 million
- Net rental income grew 5% to $10.53 million
- ACFO grew 45% to $7.68 million or $0.26 per unit
Melcor REIT (TSX: MR.UN) today announced results for the fourth quarter and year ended December 31, 2021. Rental revenue was steady at $74.09 million. Adjusted cash flow from operations (ACFO) grew 11% to $20.59 million or $0.71 per unit. ACFO better reflects our cash position and therefore our ability to pay distributions by excluding accretion expense, which is a non-cash item. Please see the table below for a reconciliation of non-GAAP financial measure ACFO.
Andrew Melton, CEO of Melcor REIT commented: “2021 proved to be a continuation of the uncertainty that unfolded in 2020 with various restrictions on businesses throughout the year. We continued to focus on relationships to assist our tenants in making it through the pandemic. These efforts resulted in a healthy retention rate of 82% and new leasing deals consisting of 76,639 sf. With new leases such as Innovate Edmonton and Habitat for Humanity’s ReStore announced earlier this year, we feel confident in our future.
We were pleased to increase our distribution throughout the year by 33% compared to December 2020 as our outlook over 2021 improved. The Board of Trustees remains grateful to the REIT team and our tenants for their resilience through a challenging period. We are also grateful to our Unitholders for your confidence that we will protect your investment and emerge stronger in the long-term.”
The Trustees have declared a cash distribution of $0.04 per unit for the month of March 2022.
2021 Highlights:
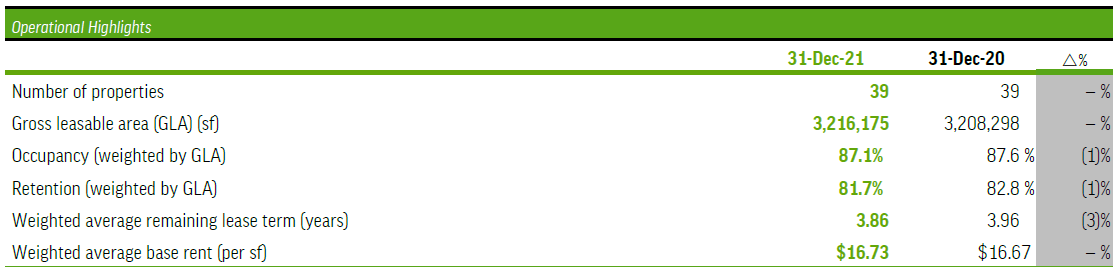
NOI grew 3% over 2020. We continued to proactively renew leases with existing tenants and achieved a healthy retention rate of 81.7% for the year. We also continue to pursue new tenant opportunities and commenced 76,639 sf in new leases in 2021. Occupancy remained stable at 87.1%. This positive leasing performance contributed to growth in NOI, FFO, AFFO and ACFO in the year. Due to COVID-19 related anomalies, prior year comparisons are less meaningful with impacts ranging from reduced spending to elevated bad debt.
Other factors that contributed to year over year changes in results include:
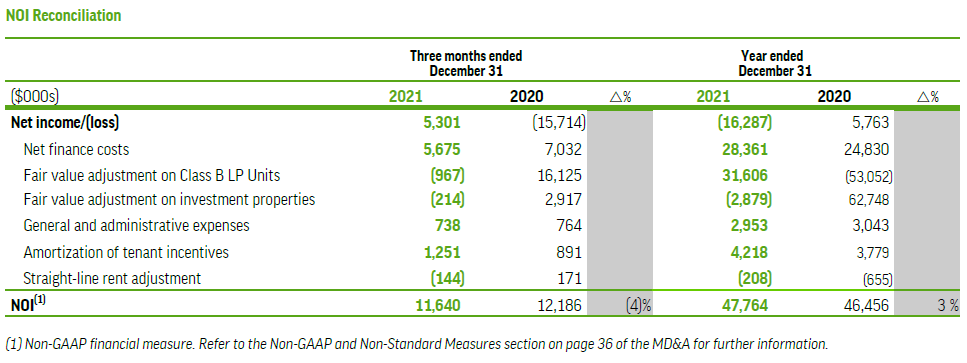
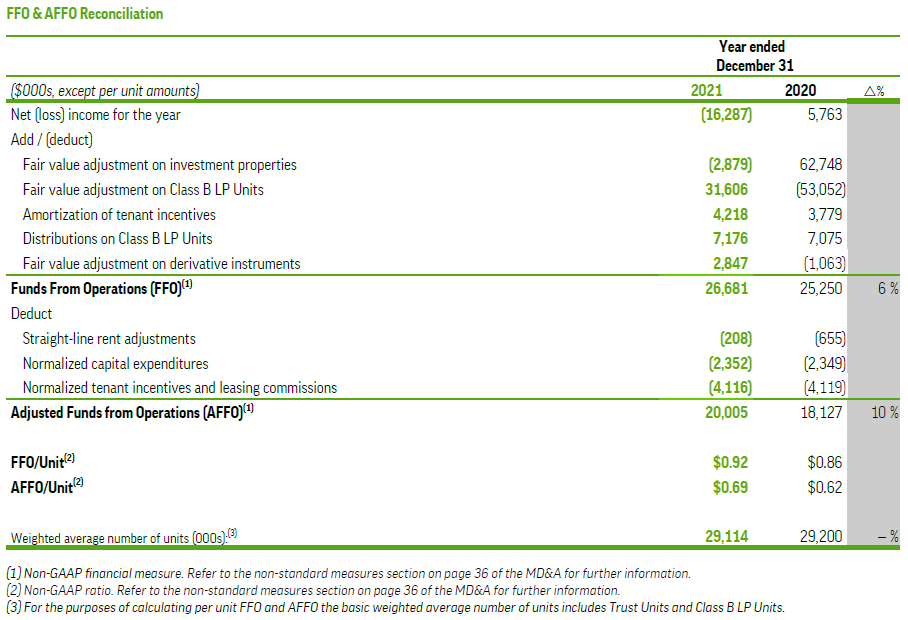
- Non-cash Fair Value Adjustments: Non-cash fair value adjustments on REIT units and investment properties often cause dramatic swings in results. The change in unit price has a counter-intuitive impact on net income, as an increase in unit value decreases net income. The 41% increase in the trading price of the REIT’s units compared to December 31, 2020 resulted in a $31.61 million year-to-date loss on the valuation of our Class B LP Units. In the comparative period, net income was also significantly impacted by fair value adjustments on investment properties due to revaluation of the entire portfolio in Q2-2020. This event had a significant impact to net income in both the current and prior periods, making comparison less meaningful, and a reason management prefers FFO and ACFO as better measures of our performance.
- Early Termination event: In Q1-2021, we received $1.00 million for the early lease termination of a fast food chain occupying 6,384 sf in Leduc Common. The tenant made up 0.4% of 2020 base rent and had 11 years remaining on a 20 year lease. Early termination also resulted in $0.19 million in reduced straight-line rent (SLR) adjustments.
- Distribution Increase: In August 2021, we increased our monthly distribution by 14% to $0.04 per unit. Since December 2020, we have increased our monthly distribution by 33%.
FINANCIAL HIGHLIGHTS
- Revenue was steady during the year at $74.09 million (2020 – $74.57 million) and net operating income (NOI) was up 3%.
- FFO was up 6% to $26.68 million or $0.92 per unit at December 31, 2021 (2020 – $25.25 million or $0.86 per unit) as a direct result of higher NOI. Management believes FFO is a better reflection of our true operating performance.
- Adjusted cash from operations (ACFO) was $20.59 million or $0.71 per unit (2020 – $18.58 million or $0.64 per unit) due to increased FFO, fluctuation in SLR and the Early Termination event impact on other revenue. Management believes that ACFO best reflects our cash position and therefore our ability to pay distributions.
- Net income in the current and comparative period is significantly impacted by the Non-cash Fair Value Adjustments described above.
- We re-financed eight mortgages during the year at a weighted average interest rate of 2.77% for proceeds of $74.29 million (net $20.02 million).
- As at December 31, 2021 we had $7.26 million in cash and $35.00 million in additional capacity under our revolving credit facility.
OPERATING HIGHLIGHTS
We continued to execute on our proactive leasing strategy to both retain existing and attract new tenants. We completed lease renewals representing 240,006 sf (including holdovers) for a retention rate of 81.7% at December 31, 2021. New leasing has been steady across the portfolio with 76,639 sf in new deals commencing in 2021 and an additional 127,358 sf committed for future occupancy. Occupancy was also relatively stable at 87.1%.
CREATING UNITHOLDER VALUE
We increased our distributions beginning in August by 14% to $0.04 per unit compared to $0.035 per trust unit January through July for a FFO payout ratio of 49% (2020 – 51%) and an ACFO payout ratio of 63% (2020 – 69%).
On April 1, 2021 we commenced a new NCIB to buy back our trust units. We are entitled to purchase up to 652,525 trust units for cancellation, representing approximately 5% of the REIT’s issued and outstanding trust units. The maximum daily purchase limit is 3,824 units, purchased at market price. Including units purchased under the prior NCIB, we purchased a total of 85,683 units for $0.53 million in 2021. The NCIB ends on March 31, 2022.
SUBSEQUENT EVENTS
Subsequent to December 31, 2021, we declared the following distributions:
| Month | Record Date | Distribution Date | Distribution Amount |
| January 2022 | January 31, 2022 | February 15, 2022 | $0.04 per unit |
| February 2022 | February 28, 2022 | March 15, 2022 | $0.04 per unit |
| March 2022 | March 31, 2022 | April 15, 2022 | $0.04 per unit |
(1) The abbreviation nm is shorthand for not meaningful and is used through this MD&A where appropriate.
(2) Distributions for the current period have been paid out at a rate of $0.035 per unit per month from January to July and at a rate of $0.04 per unit for August and December. Distributions for the comparative periods have been paid out at a rate of $0.05625 per unit per month from January to March 2020 and at a rate of $0.03 per unit from April 2020 onward.
(3) For the purposes of calculating per unit net income the basic weighted average number of units includes Trust Units and the diluted weighted average number of units includes Class B LP Units and convertible debentures, to the extent that their impact is dilutive.
(4) For the purposes of calculating per unit FFO, AFFO and ACFO the basic weighted average number of units includes Trust Units and Class B LP Units.
(5) Non-GAAP financial measure. Refer to the Non-GAAP and Non-Standard Measures section on page 36 of the MD&A for further information.
(6) Non-GAAP ratio. Refer to the Non-GAAP and Non-Standard Measures section on page 36 of the MD&A for further information.
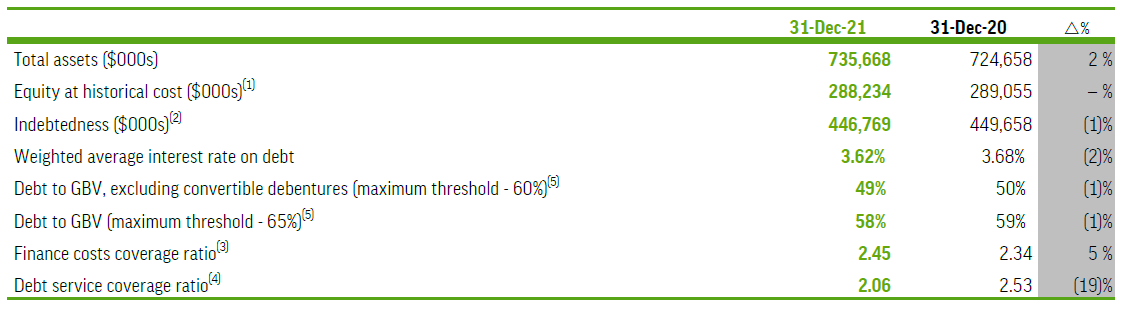
(1) Calculated as the sum of trust units and Class B LP Units at their historical cost. In accordance with IFRS the Class B LP Units are presented as a financial liability in the consolidated financial statements. Please refer to page 22 of the MD&A for the calculation of Equity at historical cost.
(2) Calculated as the sum of total amount drawn on revolving credit facility, mortgages payable, Class C LP Units, excluding unamortized fair value adjustment on Class C LP Units and convertible debentures, excluding unamortized discount and transaction costs. Please refer to page 22 of the MD&A for the calculation of Indebtedness.
(3) Non-GAAP financial ratio. Calculated as the sum of FFO and finance costs; divided by finance costs, excluding distributions on Class B LP Units and fair value adjustment on derivative instruments. This metric is not calculated for purposes of covenant compliance on any of our debt facilities. Please refer to page 36 of the MD&A for further discussion and analysis.
(4) Non-GAAP financial ratio. Calculated as FFO; divided by sum of contractual principal repayments on mortgages payable and distributions of Class C LP Units, excluding amortization of fair value adjustment on Class C LP Units. This metric is not calculated for purposes of covenant compliance on any of our debt facilities. Please refer to page 36 of the MD&A for further discussion and analysis.
(5) Debt to GBV is a Non-GAAP ratio. Refer to the Non-GAAP and Non-Standard Measures section on page 36 of the MD&A for further information.
MD&A and Financial Statements
Information included in this press release is a summary of results. This press release should be read in conjunction with Melcor REIT’s 2021 consolidated financial statements and management’s discussion and analysis, which can be found on the REIT’s website at www.MelcorREIT.ca or on SEDAR (www.sedar.com).
Conference Call & Webcast
Unitholders and interested parties are invited to join management on a conference call to be held March 4, 2022 at 11:00 AM ET (9:00 AM MT). Call 1-416-915-3239 in the Toronto area; 1-800-319-4610 toll free.
The call will be webcast at https://www.gowebcasting.com/11711. A replay of the call will be available shortly after the call is concluded at the same address.
Annual General Meeting
PLEASE NOTE: This year, in response to the COVID-19 pandemic, and in order to conduct the meeting in a manner that protects the health and safety of our trustees, unitholders and the public at large, the meeting will be webcast with voting only by instrument of proxy. We invite unitholders to join our annual meeting on May 19, 2022 at 9:30 MT am at https://www.gowebcasting.com/11744.
About Melcor REIT
Melcor REIT is an unincorporated, open-ended real estate investment trust. Melcor REIT owns, acquires, manages and leases quality retail, office and industrial income-generating properties with exposure to high growth western Canadian markets. Its portfolio is currently made up of interests in 39 properties representing approximately 3.22 million square feet of gross leasable area located across Alberta and in Regina, Saskatchewan; and Kelowna, British Columbia. For more information, please visit www.MelcorREIT.ca.
Non-standard Measures
NOI, Same-asset NOI, FFO, AFFO and ACFO are key measures of performance used by real estate operating companies; however, they are not defined by International Financial Reporting Standards (“IFRS”), do not have standard meanings and may not be comparable with other industries or income trusts. These non-IFRS measures are more fully defined and discussed in the REIT’s management discussion and analysis for the period ended December 31, 2021, which is available on SEDAR at www.sedar.com.
Forward-looking Statements:
This press release may contain forward-looking information within the meaning of applicable securities legislation, which reflects the REIT’s current expectations regarding future events. Forward-looking information is based on a number of assumptions and is subject to a number of risks and uncertainties, many of which are beyond the REIT’s control, that could cause actual results and events to differ materially from those that are disclosed in or implied by such forward-looking information. Such risks and uncertainties include, but are not limited to, general and local economic and business conditions; the financial condition of tenants; the REIT’s ability to refinance maturing debt; leasing risks, including those associated with the ability to lease vacant space; and interest rate fluctuations. The REIT’s objectives and forward-looking statements are based on certain assumptions, including that the general economy remains stable, interest rates remain stable, conditions within the real estate market remain consistent, competition for acquisitions remains consistent with the current climate and that the capital markets continue to provide ready access to equity and/or debt. All forward-looking information in this press release speaks as of the date of this press release. The REIT does not undertake to update any such forward-looking information whether as a result of new information, future events or otherwise. Additional information about these assumptions and risks and uncertainties is contained in the REIT’s filings with securities regulators.
Contact Information:
Investor Relations
Tel: 1.855.673.6931
ir@melcorREIT.ca
Information note:
Please note that the numerical information stated in press releases are outlined as-at the date of the press release.
Share this article:
RSS Feed